Public information · NYS DOL release
New York labor market, live
The Department of Labor's monthly labor-market release, redesigned as one live sheet: it pulls the same Bureau of Labor Statistics series the release is built from and redraws when a new month is published.
Built to WCAG 2.1 AA and Section 508: measured contrast, keyboard-stepped charts, every value in an HTML table, and a tagged PDF. Full note in the release.
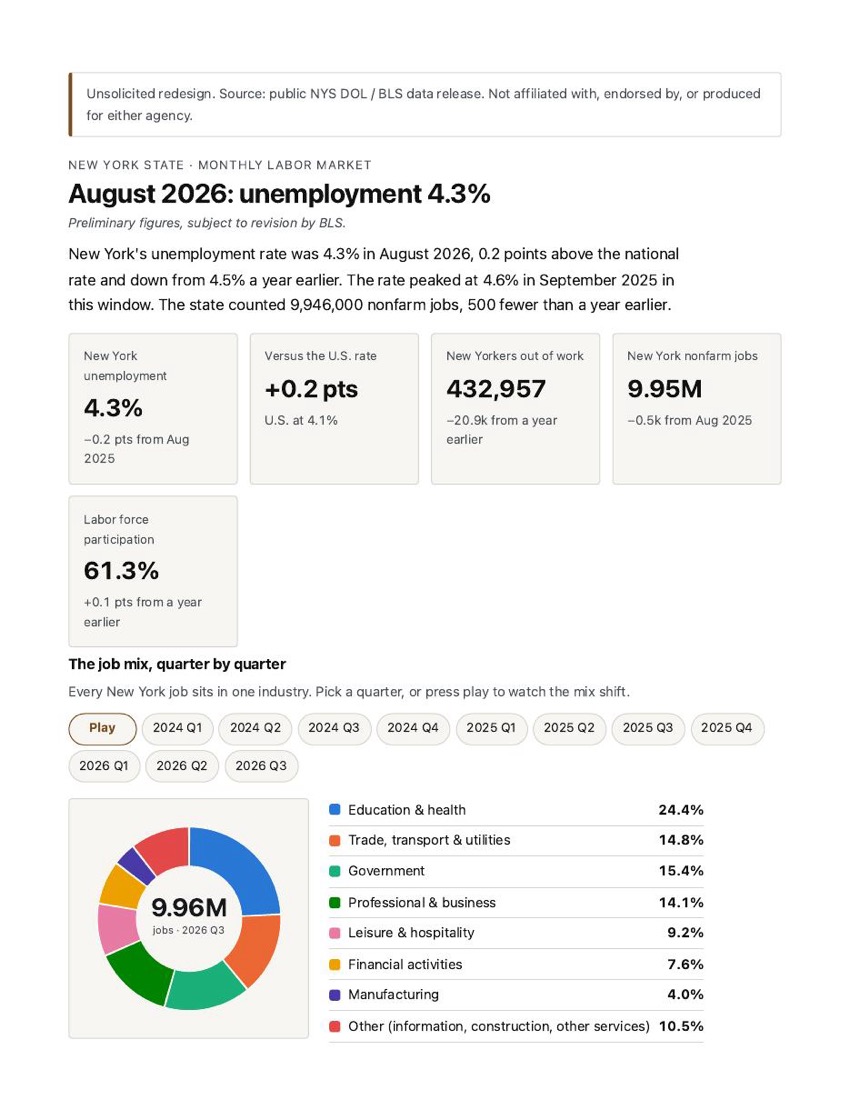
Unsolicited redesign. Source: public NYS DOL / BLS data release. Not affiliated with, endorsed by, or produced for either agency.
New York State · Monthly labor market
August 2026: unemployment 4.3%
Preliminary figures, subject to revision by BLS.
New York's unemployment rate was 4.3% in August 2026, 0.2 points above the national rate and down from 4.5% a year earlier. The rate peaked at 4.6% in September 2025 in this window. The state counted 9,946,000 nonfarm jobs, 500 fewer than a year earlier.
Figures from the BLS public API, built 2026-09-22.
Charts step between months and quarters; turn this off for instant changes.
New York unemployment
4.3%
−0.2 pts from Aug 2025
Versus the U.S. rate
+0.2 pts
U.S. at 4.1%
New Yorkers out of work
432,957
−20.9k from a year earlier
New York nonfarm jobs
9.95M
−0.5k from Aug 2025
Labor force participation
61.3%
+0.1 pts from a year earlier
The job mix, quarter by quarter
Every New York job sits in one industry. Pick a quarter, or press play to watch the mix shift.
- Education & health24.4%
- Trade, transport & utilities14.8%
- Government15.4%
- Professional & business14.1%
- Leisure & hospitality9.2%
- Financial activities7.6%
- Manufacturing4.0%
- Other (information, construction, other services)10.5%
Open the full release metro areas · industries · rates · jobs · data
Across the state, July 2026
Unemployment rate by metro area, ordered by the latest month. The Capital Region, home of the Department of Labor, is highlighted.
Where the jobs moved, August 2026
Change in New York jobs over the past year, by industry, in thousands, ordered by the latest month.
Unemployment rate, New York vs. U.S.
Jobs added or lost each month
The data
Statewide, all 32 months
| Month | NY unemployment | U.S. unemployment | NY nonfarm jobs | Change |
|---|---|---|---|---|
| August 2026 (P) | 4.3% | 4.1% | 9,946.0 | −23.5 |
| July 2026 | 4.4% | 4.1% | 9,969.5 | −13.1 |
| June 2026 | 4.6% | 4.2% | 9,982.6 | −11.6 |
| May 2026 | 4.6% | 4.3% | 9,994.2 | +16.5 |
| April 2026 | 4.6% | 4.3% | 9,977.7 | −1.3 |
| March 2026 | 4.6% | 4.3% | 9,979.0 | +1.9 |
| February 2026 | 4.6% | 4.4% | 9,977.1 | −23.5 |
| January 2026 | 4.6% | 4.3% | 10,000.6 | +17.3 |
| December 2025 | 4.6% | 4.4% | 9,983.3 | +26.4 |
| November 2025 | 4.6% | 4.5% | 9,956.9 | +11 |
| October 2025 | n/a | n/a | 9,945.9 | −5.8 |
| September 2025 | 4.6% | 4.4% | 9,951.7 | +5.2 |
| August 2025 | 4.5% | 4.3% | 9,946.5 | +6.4 |
| July 2025 | 4.4% | 4.3% | 9,940.1 | −8.8 |
| June 2025 | 4.3% | 4.1% | 9,948.9 | −4.7 |
| May 2025 | 4.2% | 4.3% | 9,953.6 | +19.8 |
| April 2025 | 4.1% | 4.2% | 9,933.8 | −53.1 |
| March 2025 | 4.1% | 4.2% | 9,986.9 | +18.2 |
| February 2025 | 4.1% | 4.2% | 9,968.7 | +6.9 |
| January 2025 | 4.1% | 4.0% | 9,961.8 | +18.2 |
| December 2024 | 4.1% | 4.1% | 9,943.6 | +13.4 |
| November 2024 | 4.1% | 4.2% | 9,930.2 | +13.4 |
| October 2024 | 4.1% | 4.1% | 9,916.8 | −5.9 |
| September 2024 | 4.2% | 4.1% | 9,922.7 | +35.7 |
| August 2024 | 4.2% | 4.2% | 9,887.0 | +6.3 |
| July 2024 | 4.2% | 4.2% | 9,880.7 | −28.4 |
| June 2024 | 4.2% | 4.1% | 9,909.1 | +29.8 |
| May 2024 | 4.2% | 3.9% | 9,879.3 | +13.1 |
| April 2024 | 4.2% | 3.9% | 9,866.2 | +28.1 |
| March 2024 | 4.1% | 3.9% | 9,838.1 | +28.6 |
| February 2024 | 4.1% | 3.9% | 9,809.5 | +13.2 |
| January 2024 | 4.1% | 3.7% | 9,796.3 | — |
Metro areas
| Metro area | Rate | vs. a year earlier |
|---|---|---|
| Albany–Schenectady–Troy | 3.7% | +0.1 pts |
| Binghamton | 4.3% | ±0 pts |
| Buffalo–Niagara Falls | 4.4% | +0.1 pts |
| Elmira | 4.0% | ±0 pts |
| Glens Falls | 3.4% | +0.2 pts |
| Ithaca | 4.2% | +0.1 pts |
| Kingston | 4.0% | +0.1 pts |
| Poughkeepsie–Newburgh | 4.0% | ±0 pts |
| New York City metro | 4.3% | −1.1 pts |
| Rochester | 4.2% | +0.2 pts |
| Syracuse | 4.1% | +0.2 pts |
| Utica–Rome | 4.2% | +0.1 pts |
| Watertown–Fort Drum | 4.2% | ±0 pts |
Industries
| Industry | Jobs | vs. a year earlier |
|---|---|---|
| Construction & mining | 386.6 | −5.1 |
| Manufacturing | 396.3 | −7.6 |
| Trade, transport & utilities | 1,475.4 | −11.2 |
| Information | 269.4 | −4.7 |
| Financial activities | 759.1 | +1.6 |
| Professional & business | 1,397.9 | +4.6 |
| Education & health | 2,427.1 | +25 |
| Leisure & hospitality | 920.3 | −13.5 |
| Other services | 381.8 | +2.1 |
| Government | 1,532.1 | +8.3 |
Job mix by quarter
| Quarter | Education & health | Trade, transport & utilities | Government | Professional & business | Leisure & hospitality | Financial activities | Manufacturing | Other (information, construction, other services) | All jobs (000s) |
|---|---|---|---|---|---|---|---|---|---|
| 2026 Q3 (part) | 24.4% | 14.8% | 15.4% | 14.1% | 9.2% | 7.6% | 4.0% | 10.5% | 9,958.0 |
| 2026 Q2 | 24.5% | 14.8% | 15.3% | 14.1% | 9.3% | 7.6% | 4.0% | 10.4% | 9,984.8 |
| 2026 Q1 | 24.5% | 14.8% | 15.2% | 14.1% | 9.3% | 7.6% | 4.0% | 10.5% | 9,985.7 |
| 2025 Q4 | 24.3% | 14.9% | 15.3% | 14.0% | 9.4% | 7.6% | 4.0% | 10.5% | 9,962.0 |
| 2025 Q3 | 24.2% | 14.9% | 15.3% | 14.0% | 9.4% | 7.6% | 4.1% | 10.5% | 9,946.0 |
| 2025 Q2 | 24.3% | 14.9% | 15.2% | 14.0% | 9.3% | 7.6% | 4.1% | 10.5% | 9,945.4 |
| 2025 Q1 | 24.1% | 15.0% | 15.1% | 14.2% | 9.4% | 7.6% | 4.1% | 10.5% | 9,972.6 |
| 2024 Q4 | 24.0% | 15.0% | 15.1% | 14.1% | 9.4% | 7.6% | 4.1% | 10.6% | 9,930.2 |
| 2024 Q3 | 23.8% | 15.0% | 15.2% | 14.2% | 9.4% | 7.6% | 4.2% | 10.7% | 9,896.7 |
| 2024 Q2 | 23.7% | 15.1% | 15.1% | 14.2% | 9.4% | 7.6% | 4.2% | 10.7% | 9,884.8 |
| 2024 Q1 | 23.4% | 15.2% | 15.1% | 14.2% | 9.4% | 7.6% | 4.3% | 10.9% | 9,814.8 |
Source and method
U.S. Bureau of Labor Statistics, Local Area Unemployment Statistics and Current Employment Statistics, produced in cooperation with the New York State Department of Labor, via the BLS public API. Statewide and industry figures are seasonally adjusted; metro-area rates are not, and run a month behind the statewide release. (P) = preliminary, subject to revision. October 2025 unemployment rates were not published because of the 2025 federal funding lapse; the chart leaves that month as a gap rather than interpolating. The panel checks BLS twice a day and redraws when a new month is released.
Accessibility note
- Standard
- WCAG 2.1 AA; Section 508.
- Charts
- Static SVG with a title and description; every value is repeated in a real HTML table. Nothing here needs JavaScript to read.
- Keyboard
- The two time charts are focusable; ← → step month by month, and the readout is announced to screen readers.
- Contrast
- Measured with the WCAG 2.1 formula (2026-09-22). Text: body 17.5:1, secondary 8.1:1, links 7.2:1 on light; 13.5:1, 7.3:1, 7.6:1 on dark. Chart marks against their panel: 4.3:1 and 3.1:1 on light, 4.5:1 and 4.2:1 on dark, above the 3:1 minimum for graphics.
- Color
- Series colors checked for color-vision deficiency (protan, deutan, tritan). Every series is also named in text, so identity never depends on color.
- Live data
- Updates arrive without moving focus or scrolling; the status line announces when newer figures load.
- A tagged PDF print sheet carries the same content and tables.
Time charts: focus one and use ← → to step through months. Every value is also in the tables.
Six-page tagged PDF print sheet, same data and tables. Open the PDF.